THE KPI (Key Performance Indicator) are the success indicators of an ecommerce site. The KPIs are metrics that allow us on a daily basis to understand if we are doing a good job or not.
Ecommerce KPIs can be calculated for all processes of the ecommerce value chain. What does it mean? It means that we can evaluate the work we are doing in numerical terms on all fronts of ecommerce: logistics, design, communication, systems, buying, customer service.
Here are the main KPIs I use
- KPI of use of the site: (1) Number of sessions o visits, Average session length, Number of (2) pages viewed per session
- KPI Digital Marketing: (3) Traffic acquisition cost, Cost per sale, (4) ROAS (Return On Advertising Spend), Bounce rate
- Technological KPIs: (5) Site Speed, Server Response Time, Page Load Time
- Commercial KPIs: (6) Sales, Average order value, (7) Sell Through, Frequency of purchase, (8) Conversion Rate
- KPI operations: product publication times, digital production cost per product, (9) evaluation of the customer care service, number of contacts managed and closed, (10) number of contacts per order
- Logistic KPIs: pick-up and packing times, (11) delivery times, number of complaints, (12) number of lost packages
- (13) Returns at value: the percentage of value returns can be determined by the quality of the product or by the ability to correctly communicate the characteristics of the product.
- Lead generation: (14) No. of registrations to the newsletter, No. of accounts created, (15) No. of cancellations from the newsletter
The KPIs must be evaluated with respect to the objectives and / or with respect to the previous period:
- Budget
- Forecast
- Same period of the previous year
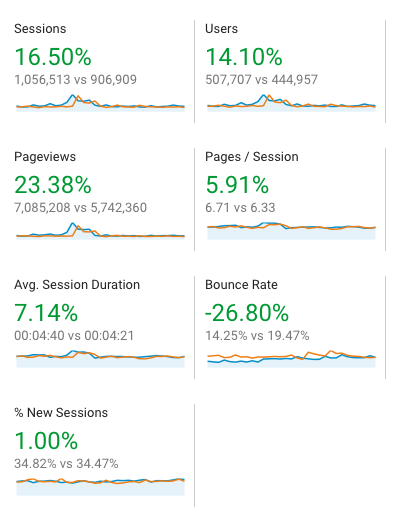
For this last point, the period comparison function of Google Analytics is very useful
Among all the KPIs, one of the most relevant is the Ecommerce Conversion Rate (Ecommerce Conversion Rate or simply Conversion Rate) or the ratio between the number of orders (or transactions) and the number of visits to the site.
CR = N ° Orders / N ° of Sessions
The conversion rate in ecommerce is important because, all other things being equal, if we manage to improve it, we increase the ecommerce turnover proportionally.
A 20% increase in the conversion rate, all other conditions being equal, determines an increase in the turnover of 20%.
This is why a discipline was born that deals specifically with the optimization of the site aimed at increasing the conversion rate: CRO = Conversion Rate Optimization
I would like to underline that the conversion rate must be calculated on visits (or sessions) and not on visitors. The reason I wrote it in this other post on the specific topic of Conversion Rate
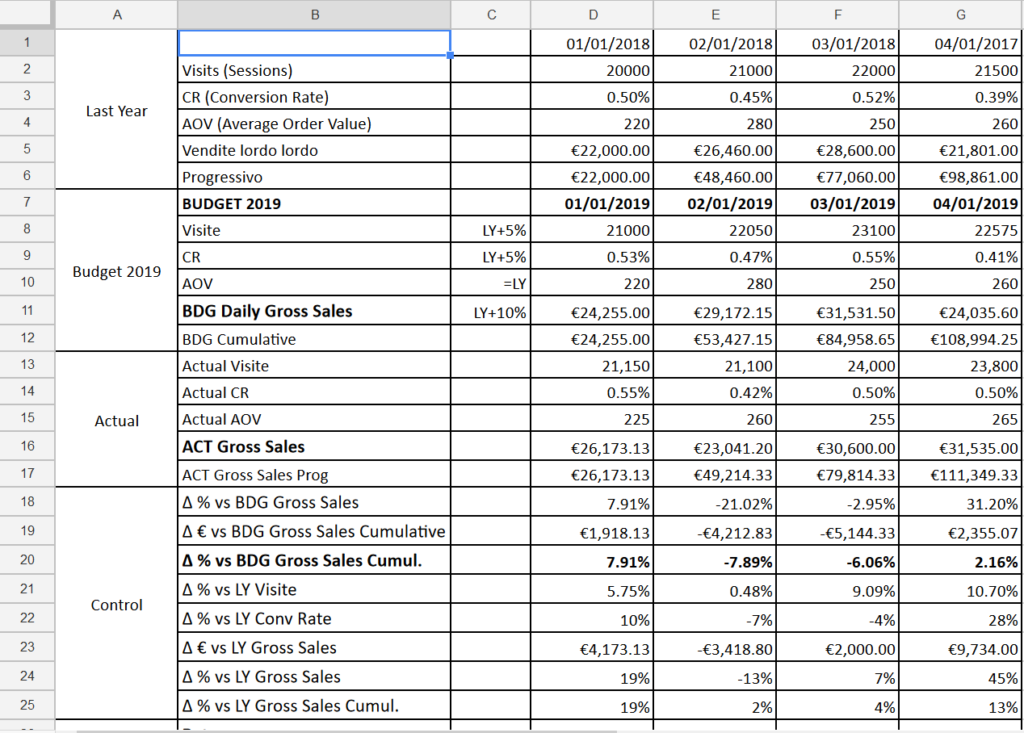
Below we see an example of Budget Ecommerce which takes into account the KPIs of the previous year, sets the objectives for the following year (budget) and keeps track of theadvancement on a daily basis

Bounce rate (%) or bounce rate
The bounce rate, more than a KPI, is a metric that measures the ability of your site to retain users once they arrive on the site. If your site is unable to retain users after the first page they view and they leave, there will be a bounce.
Therefore
- a user who visits a page and leaves the site is a bounce.
- a user who visits two or more pages is not a bounce
The bounce rate can be interpreted positively or negatively. In fact, it can be said that a Bounce user may have found what he was looking for and then left, for example a cooking recipe.
My suggestion is to use this metric in relative terms of period-to-period comparison. For example, has my bounce rate increased in the last month, compared to the previous month?
Average CPC
CPC or Cost Per Click is a metric related to online advertising. Or how much do we pay for each user we bring to our site through advertising on Adwords?
In fact, most forms of online advertising have an associated cost for each click made by users on banners or other forms of advertising.
CPA Cost for Acquisition
The Cost per Acquisition is a summary metric relating to advertising, that is, it accounts for how much we spend on advertising to get an ecommerce order on the site.
It is an important metric because it determines the efficiency of advertising investments. If we spend an average of 30 Euros on advertising for each order received and our average order value is 30 Euros we are spending everything we collect on advertising and this makes the business model unsustainable. If we spend 30 euros but our average order is 100 euros, we will still have to make careful assessments in terms of margins but it is more likely that the business model is sustainable.

Visits (sessions)
Site visits are the first fundamental since it shows the vitality of the site. Without visits, there can be no business. The visits that are also referred to as sessions on Google Analytics, all entries on the site count. If a person enters the site twice, they will, in principle, register two sessions and one user. If a person connects to your site with two different devices, on the other hand, it is likely that two users and two visits will be registered. This is because in some cases the reporting systems are not able to understand that two devices correspond to a user. For example, a person who connects to the same site first from the smart phone and then from the desktop.
Transactions and conversions
E-commerce transactions or e-commerce orders correspond to traditional sales in a store, or receipts issued. Each transaction (or order) can contain multiple products. The average order value is called the AOV Average Order Value.
Before getting to the transaction there can be some intermediate conversions called micro-conversions, which are almost as important and which are:
- subscriptions to the newsletter
- the additions of products to the cart or wishlist
Negative KPIs
On the other hand, unsubscribers must also be tracked, i.e. the number of users who unsubscribe from your mailing list or newsletter.
And the return rate on orders should also be monitored. Since in the e-commerce legislation it is possible to return products purchased online and get a refund of the money spent, the return rate is a factor that has a great impact on the sustainability of the business.
Average session duration
The average duration of sessions or views, another data made available by Google Analytics, is useful for measuring the level of engagement and must be related to the number of pages viewed and the speed of the site.
If the speed of the site is stable so there are no slowdowns in navigation due to technical factors and the number of pages viewed is stable or increases and the average duration of the sessions increases, it generally means that users spend more time interacting with your site. and with your brand which is generally considered a good thing.
In summary:
KPI of acquisition
| KPI | Description |
| CPC | Cost per Click |
| CPL | Cost per Lead |
| CPO | Cost Per Order |
| Sessions | New users vs Last Year |
| Session / Channel | Number of sessions vs Last Year |

